While it looks like stocks could continue bouncing higher in the immediate term, portfolio manager Lance Roberts isn't convinced the sell-off is done yet.
He and his firm aren't back to buying yet, as they expect a better chance to enter at lower prices in coming weeks.
We discuss that in today’s video, as well as the recent upwards surprise in GDP, Fed rate cut odds, Zombie company risk, the un-inverting yield curve, and Lance's firm's latest trades.
For all the mattered to markets, watch this week's Market Recap by clicking here or on the video below:
Sven Henrich: We're Living Through The Most Distorted Business Cycle In History
Top ETF Expert Reveals 4 Powerful Macro Trends Driving Markets Through 2025 | Jan Van Eck
TM NOW ON PODCAST PLAYERS
Just a reminder that if you prefer to listen to my interviews on your podcast player, Thoughtful Money is now available on the major podcast platforms:
I’m so grateful to everyone who has kindly supported me by becoming a premium subscriber to this new Substack. It’s making an important difference in helping me afford the substantial startup costs of running Thoughtful Money.
Premium supporters now receive my “Adam’s Notes” summaries to the interviews on this channel, plus periodic advance-viewing and/or exclusive content not made available to the public, and now our new MacroPass service.
If you, too, would like to become a premium subscriber to this Substack (it’s only $15/mo, less than $0.50/day), then sign up now:
But whether you do or not, get ready for another week of more great content ahead. We have interviews with Gretchen Morgenson, Melody Wright, Axel Merk & Claudia Sohn.
Stay tuned!
cheers,
A
My sincere thanks to Lance Roberts and his team at Real Investment Advice for kindly making their weekly Bull/Bear market report available to the Thoughtful Money audience below:
Pullback Doesn’t Deter Investor Bullishness
By Lance Roberts | July 27, 2024
Inside This Week’s Bull Bear Report
Pullback Doesn’t Deter Investor Bullishness
How We Are Trading It
Research Report – Can Mega-Caps Continue Their Dominance?
Youtube – Before The Bell
Market Statistics
Stock Screens
Portfolio Trades This Week
Rationalizing The Chaos
Previously, we noted that a pullback was needed to resolve the market’s overbought and extended conditions. As expected, the correction accelerated this past week as the 20-DMA failed to hold.
“However, if the 20-DMA fails, as in early April, the 50-DMA becomes the next logical support, with the 100-DMA close behind. Such would encompass another 3-5% correction.“
This past week, that pullback continued with the market breaking through the 20-DMA and testing the 50-DMA on Thursday. As we noted in Friday’s Daily Market Commentary (Subscribe for free daily pre-market email):
“Whenever there is a market decline, we humans must try to rationalize the ‘chaos’ by assigning a reason to it. The most recent rationalization is that the ‘AI trade’ is dead. As noted by the better-than-expected revenue and earnings from Google (GOOG), most earnings growth comes from the largest companies. As such, we seriously doubt that managers will abandon these companies anytime soon. Furthermore, given that hedge funds need to move large amounts of capital at a time, these large-cap companies are the only companies that provide the needed liquidity.
However, every time these ‘Mega-Cap’ companies pull back, the media assigns a new rationale for why it is happening. The reality is that these companies have posted stellar returns this year, and a bit of profit-taking is unsurprising, just as we have seen at each previous market peak over the last two years. The chart below compares the darlings of the ‘AI trade,’ Apple (AAPL), Microsoft (MSFT), Google (GOOG), and Amazon (AMZN) to the S&P 500 index. (I would have included NVDA, but it has rallied so much that it skews the chart too much.)
When the S&P 500 index advances or declines, there is a high price correlation with the ‘Mega-Cap’ stocks. That correlation should be unsurprising because they make up ~35% of the index. The crucial point is that the current correction is likely just like every other correction we have seen over the last few years. It is highly likely that when this current corrective process concludes, large-cap stocks will once again resume their leadership.“
Our need to “rationalize the chaos” can lead us to make poor investment decisions. So far, the correction remains quite ordinary, with volatility remaining quite suppressed. Furthermore, the market reclaimed and held the 50-DMA on Friday with an encouraging broad market rally. However, while the markets are oversold enough for a reflexive bounce, the current correction process is likely incomplete. Moreover, the MACD “sell signal” also suggests that the current upside remains limited.
It is quite likely that any short-term, reflexive rally will fail during this corrective process. For now, use rallies to rebalance portfolios and reduce risk as needed. Our only concern is that with investors remaining very bullish despite the recent pullback, a further correction is required to resolve that condition.
Pullback Doesn’t Deter Investor Bullishness
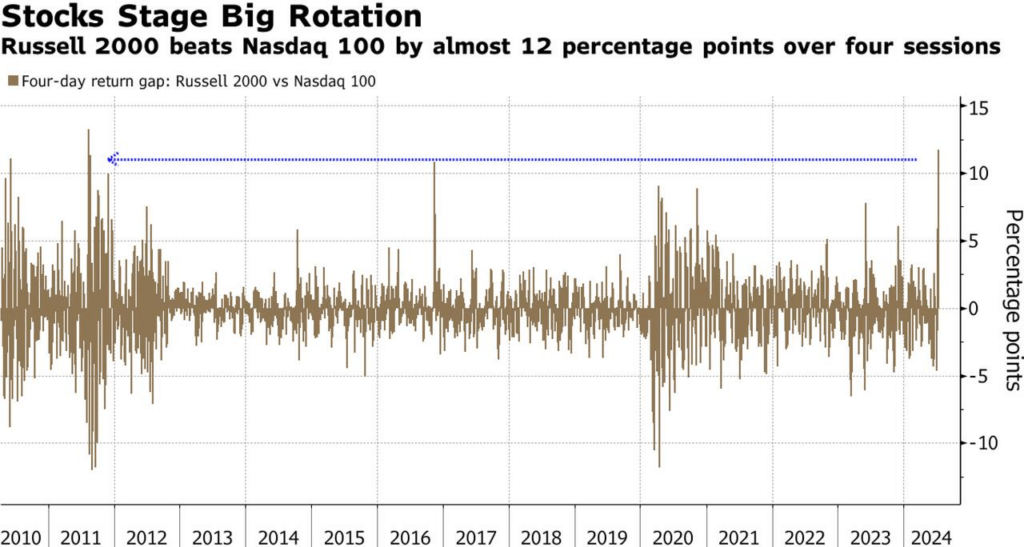
The recent pullback in large-capitalization stocks surprised investors and sent the media scurrying to proclaim the “death of the A.I. bubble.” Such certainly seemed to be the case last week when hedge fund exposure to tech dropped sharply during the past two months. At the same time, hedge funds remained highly exposed to all other sectors, and the violent selling in the “Mag 7” sparked a burst in volatility, which prompted broader selling across the board. It was one of the sharpest rotations over the last decade.
At the same time, it was one of portfolio managers’ most extensive de-grossing activities since 2022.
Without looking at a market chart, you would assume that the markets just crashed. However, as shown, such is hardly the case, and since the October 2022 lows, the recent pullback remains very ordinary.
Such is interesting because such a violent rotation should have also coincided with a sharp increase in market volatility. Yet, that did not occur, with volatility remaining suppressed within the longer-term downtrend.
While the media has been quick to jump on the rotation as the “death of A.I.,” the “rumors of its death may be greatly exaggerated.” Such is particularly the case given that portfolio allocations and sentiment by both retail and professional investors remain aggressively bullish.
A Review Of The 2022 Market Lows
In October 2022, we discussed that extreme negative sentiment was likely the basis for the end of the correction that had started in January. To wit:
“The composite index below, combining retail and institutional investor sentiment, is extremely negative and typically marks short- to intermediate-term market bottoms.”
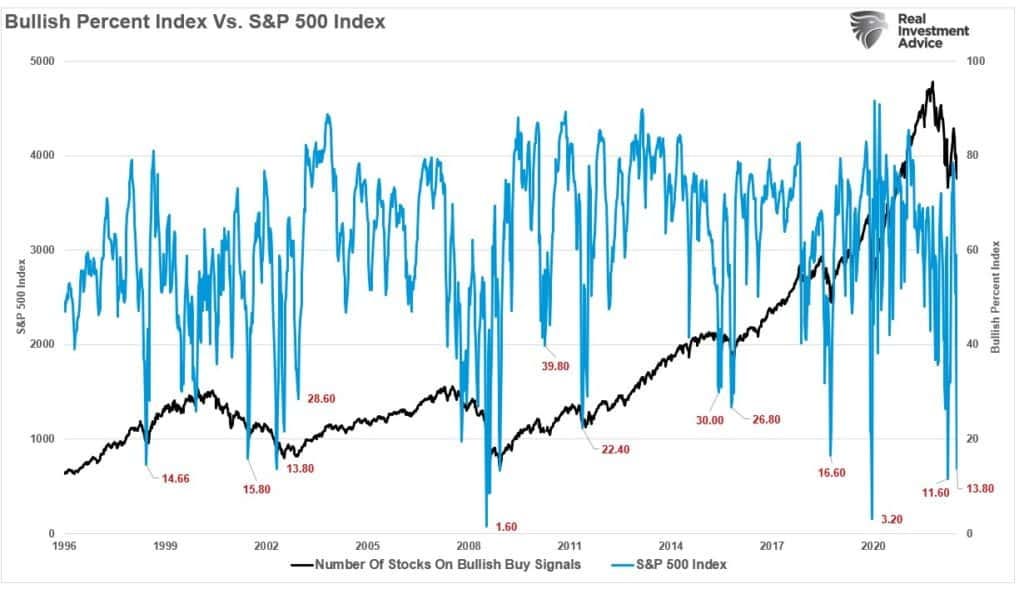
At the time, the point of that discussion was not to let emotions dictate your investing. Every mainstream economist predicted a recession, market sentiment was bearish, and investors cut allocations sharply. Furthermore, the number of stocks with “bullish buy signals” had also hit extremely low levels. The bullish percent index suggested stocks had seen rather extreme liquidations.
As we noted then,
“When levels of negativity have reached or exceeded current levels, such has historically been associated with short- to intermediate-term market bottoms.”
Notably, those more extreme levels of negative sentiment have followed periods of record-level de-grossing. However, following the recent pullback, we see a very different market picture if we review those charts today.
Investors Remain Very Bullish
As shown, net bullish sentiment is no longer near lows but near peak market levels that have typically preceded corrections. Despite the recent pullback, sentiment barely budged.
The same goes for the number of stocks on bullish buy signals. Given the pullback in large-cap stocks, seeing the index a bit lower is unsurprising. However, given the angst over the recent decline, you would have expected to see this index near previous market lows.
Notably, the allocation to equities by both retail and professional investors remains exceptionally elevated. So, despite the market pullback over the last couple of weeks, bullish sentiment and positioning remain elevated. The slight reversal in positioning is unsurprising, given the pullback. Still, it comes off levels that have often preceded short—to intermediate-term market corrections rather than a continued bull market advance.
We see that same point in the overall allocation and sentiment gauge below. Despite the correction, sentiment and allocations remain highly bullish and drastically different from the October 2022 lows.
While the pullback and rotation over the last couple of weeks were extremely rapid, from a positioning and sentiment view, little has changed. The bullish momentum remains, and given the needs of large-cap portfolio managers, hedge funds, and pension funds, which need to allocate large sums of money, the large-cap flows will likely remain intact.
In other words, I would be cautious in assuming the A.I. trade is dead, at least for now.
Still A Function Of Earnings Growth
Lastly, and probably the most important, is that despite rumors to the contrary, the bulk of earnings growth is still coming from the largest companies.
As discussed in last week’s newsletter:
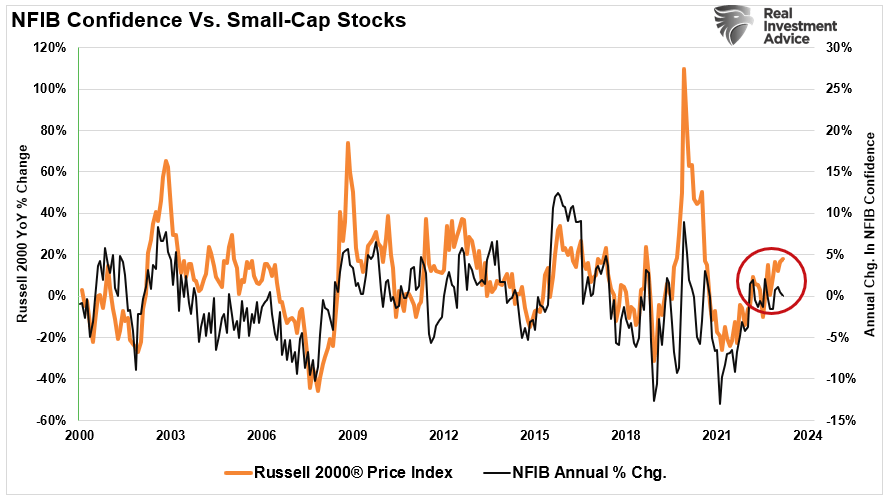
“Small-cap companies are highly dependent on more robust economic activity. We see this issue by comparing the annual rate of change in the sentiment of the National Federation of Independent Business to that of Russell 2000. The current gap is likely unsustainable. Either the economy will improve markedly, boosting small business sentiment, or Russell will catch down to the sentiment. That is something worth paying attention to.”
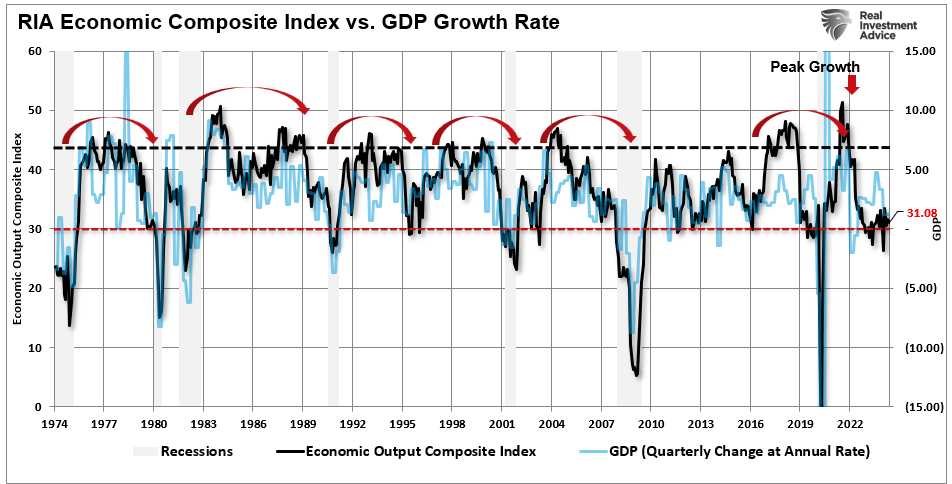
The problem is that virtually all measures, whether employment, manufacturing, or services, suggest slower economic growth. The RIA Economic Composite Index, which comprises more than 100 data points, does not suggest an economic rebound is afoot.
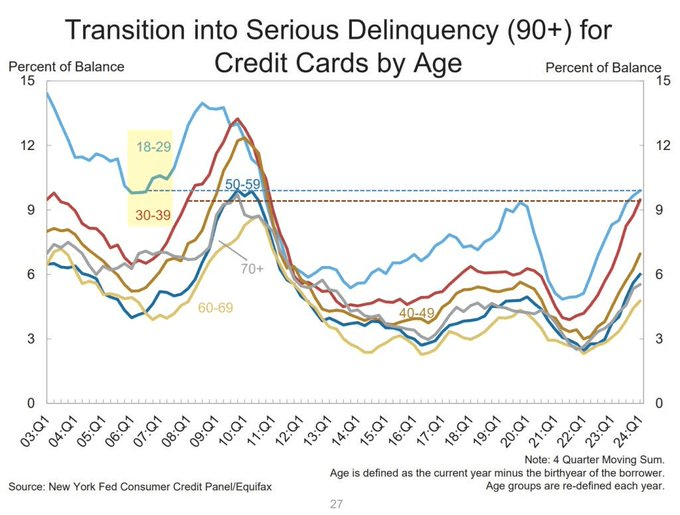
Given the weak backdrop for economic growth, as the consumer is increasingly becoming financially impaired, as seen in rising delinquency rates, the ability of smaller companies to aggressively grow earnings remains suspect.
Yes, the market is currently experiencing a normal corrective pullback. However, we doubt the narrative of a massive shift into the most economically sensitive areas of the market.
Like many other past pullbacks, we suspect this one will allow investors to add equity exposure. However, that opportunity may still be a few weeks away, so remain cautious for now.
Navigating The Pullback
As discussed over the last few months, we anticipate a 5-10% correction sometime this summer (between August and October). The more exuberant bullish sentiment and allocations need to reverse to some degree.
Are we beginning that corrective pullback now? Maybe. Unfortunately, we will only know if hindsight.
We agree that there are many reasons to be concerned about the current market. Therefore, as we have already done, we will use rallies to reduce equity exposure and hedge risks accordingly.
Move slowly. There is no rush to make dramatic changes. Doing anything in a moment of “panic” tends to be the wrong thing.
If you are overweight equities, DO NOT try to fully adjust your portfolio to your target allocation in one move. Individuals often feel like they “must” do something. Think logically about where you want to be and use a rally to adjust to that level.
Begin by selling laggards and losers. These positions were dragging on performance as the market rose, they tend to lead on the way down.
Add to sectors or positions performing with or outperforming the broader market if you need risk exposure.
Move “stop-loss” levels up to recent lows for each position. Managing a portfolio without “stop-loss” levels is like driving with your eyes closed.
Be prepared to sell into the rally and reduce overall portfolio risk. You will sell many positions at a loss simply because you overpaid for them. Selling at a loss DOES NOT make you a loser. It just means you made a mistake.
If none of this makes sense, please consider hiring someone to manage your portfolio. It will be worth the additional expense over the long term.
Follow your process.
Have a great week.
Research Report
SimpleVisor Top & Bottom Performers By Sector
S&P 500 Weekly Tear Sheet
Relative Performance Analysis
Last week, we noted:
“The recent surge above 5600 took the markets into more extreme overbought territory. Historically, such overbought conditions lead to either a consolidation or short-term correction.”
That correction began this past week, and while the S&P 500 is due for a short-term bounce, we suspect more corrective action may be needed before it is complete. Reduce risk by taking profits and raising cash levels as needed. Interest rate-sensitive sectors and small caps are the most overbought. Take profits in those areas. Technology, Discretionary, and Communications are the most oversold.
Technical Composite
The technical overbought/sold gauge comprises several price indicators (R.S.I., Williams %R, etc.), measured using “weekly” closing price data. Readings above “80” are considered overbought, and below “20” are oversold. The market peaks when those readings are 80 or above, suggesting prudent profit-taking and risk management. The best buying opportunities exist when those readings are 20 or below.
The current reading is 78.20 out of a possible 100.
Portfolio Positioning “Fear / Greed” Gauge
The “Fear/Greed” gauge is how individual and professional investors are “positioning” themselves in the market based on their equity exposure. From a contrarian position, the higher the allocation to equities, the more likely the market is closer to a correction than not. The gauge uses weekly closing data.
NOTE: The Fear/Greed Index measures risk from 0 to 100. It is a rarity that it reaches levels above 90. The current reading is 87.83 out of a possible 100.
Relative Sector Analysis
Most Oversold Sector Analysis
Sector Model Analysis & Risk Ranges
How To Read This Table
The table compares the relative performance of each sector and market to the S&P 500 index.
“MA XVER” (Moving Average Crossover) is determined by the short-term weekly moving average crossing positively or negatively with the long-term weekly moving average.
The risk range is a function of the month-end closing price and the “beta” of the sector or market. (Ranges reset on the 1st of each month)
The table shows the price deviation above and below the weekly moving averages.
Despite the correction in the broad market this past week, many sectors and markets are still trading above their respective monthly risk/reward ranges. These are mostly the “interest-rate sensitive” sectors and Gold Miners, on a bet the Fed is set to cut rates. As shown in the Relative Performance chart above, these sectors and markets are overbought, so consider taking profits and rebalancing risks in these areas.
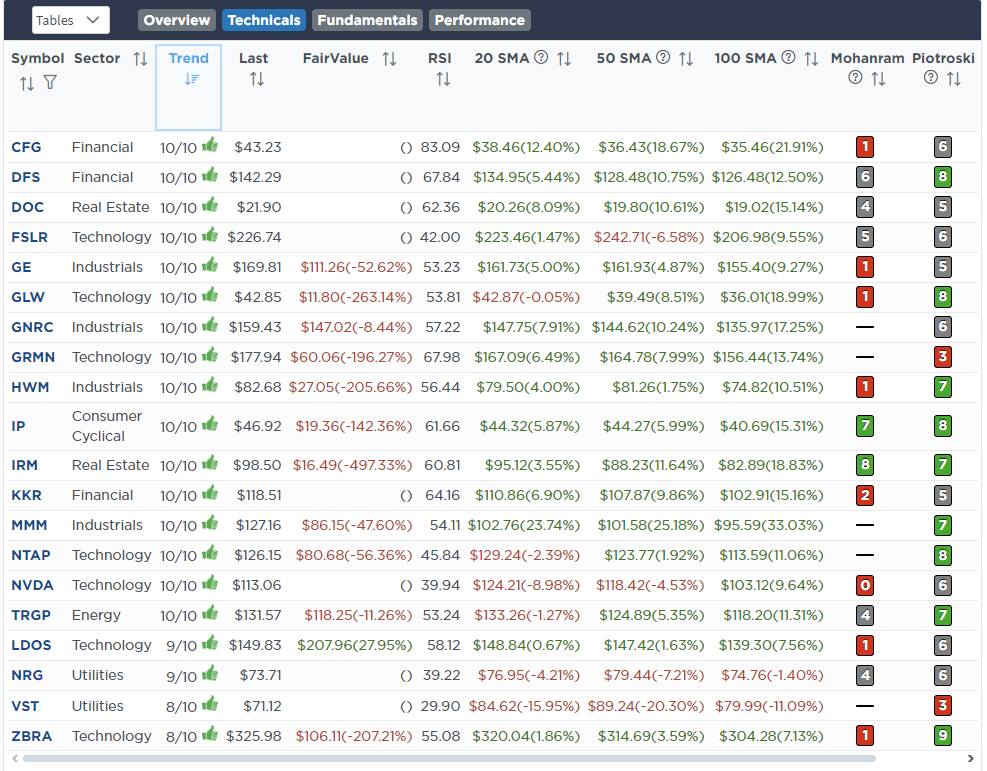
Weekly SimpleVisor Stock Screens
We provide three stock screens each week from SimpleVisor.
This week, we are searching for the Top 20:
Relative Strength Stocks
Momentum Stocks
Fundamental & Technical Strength W/ Dividends
(Click Images To Enlarge)
RSI Screen
Momentum Screen
Fundamental & Technical Screen
SimpleVisor Portfolio Changes
We post all of our portfolio changes as they occur at SimpleVisor:
No Trades This Week
Lance Roberts, C.I.O.
Have a great week!
Thoughtful Money LLC is a Registered Investment Advisor Solicitor.
We produce & distribute educational content geared for the individual investor. It’s important to note that this content is NOT investment advice, individual or otherwise, nor should be construed as such.
We recommend that most investors, especially if inexperienced, should consider benefiting from the direction and guidance of a qualified financial advisor in good standing with the Financial Industry Regulatory Authority (FINRA) who can develop & implement a personalized financial plan based on a customer’s unique goals, needs & risk tolerance.
IMPORTANT NOTE: There are risks associated with investing in securities.
Investing in stocks, bonds, exchange traded funds, mutual funds, and money market funds involve risk of loss. Loss of principal is possible. Some high risk investments may use leverage, which will accentuate gains & losses. Foreign investing involves special risks, including a greater volatility and political, economic and currency risks and differences in accounting methods.
A security’s or a firm’s past investment performance is not a guarantee or predictor of future investment performance.
Thoughtful Money. MacroPass and the Thoughtful Money logo are trademarks of Thoughtful Money LLC.
Copyright © 2024 Thoughtful Money LLC. All rights reserved.


